Integration API guide
charte.ca exposes a simple API that allows users to automate the following operations:
- download/upload chart data
- publish/unpublish a chart
- export chart svg/svgz to a local file
To access the integration API, the user must initialize the unique API key that will be used for authorization on every API call. Users can view or re-generate the API key in the user profile settings page:
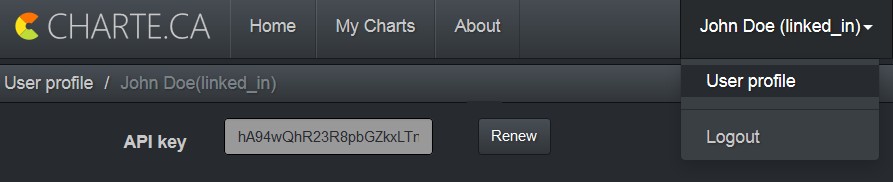
Please note that users cannot specify the API key explicitly, it must be re-generated by charte.ca. If you think that your key is compromised, just click "Renew" to re-generate the key and you can start using the new key immediately.
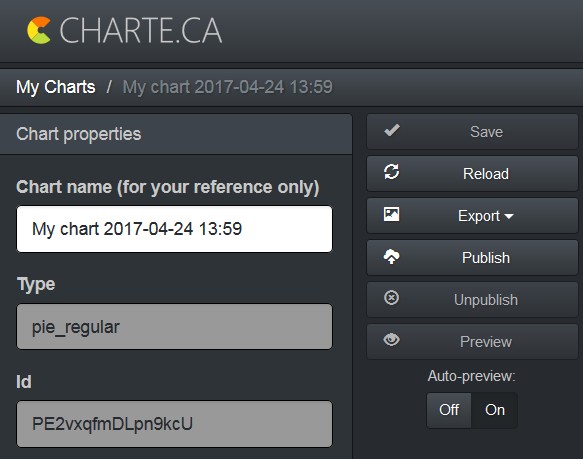
In this guide, we will be assuming the user is working with a chart id "PE2vxqfmDLpn9kcU", you can find it on the chart editor page, under "Chart properties":
Also, we will be assuming that system integrators use CURL command line utility to call charte.ca integration API. Although, it could be any tool or library that can perform HTTP calls and pass the "api-key" HTTP header.
Download data
curl -k -H "api-key: hA94wQhR23R8pbGZkxLTn3AmZ8azD8RQ" https://api.charte.ca/chart_integration/data/PE2vxqfmDLpn9kcU -o chart_data.tsv
This is what TSV data will look like:
| year | FF | Chrome | Opera | Other | Safari | IE |
|---|
| 2007 | 25 | 0 | 2 | 4 | 2 | 67 |
| 2008 | 30 | 0 | 2 | 5 | 2 | 61 |
| 2009 | 32 | 3 | 2 | 5 | 5 | 53 |
| 2010 | 31 | 10 | 2 | 11 | 2 | 44 |
| 2011 | 28 | 20 | 2 | 8 | 6 | 36 |
| 2012 | 23 | 28 | 2 | 5 | 13 | 29 |
| 2013 | 19 | 32 | 2 | 10 | 15 | 22 |
You may edit the values in the TSV file manually in the text editor or using a tool or library of your choice. After edits are complete, you can proceed to the data upload step.
Upload data
curl -X PUT -k -H "api-key: hA94wQhR23R8pbGZkxLTn3AmZ8azD8RQ" -F "file=@chart_data.tsv" https://api.charte.ca/chart_integration/data/PE2vxqfmDLpn9kcU
The data must be passed either as uploaded file ('file' field is expected) or directly in the body. Please note that the number of rows and columns in the supplied tab-separated value file must match the number of rows and columns in the existing chart, otherwise the API call will return an error.
Get config
curl -k -H "api-key: hA94wQhR23R8pbGZkxLTn3AmZ8azD8RQ" https://api.charte.ca/chart_integration/config/PE2vxqfmDLpn9kcU
This call returns JSON that represents a subset of the chart configuration. To be precise, it returns only those fields that can be modified by a "Put config" call (see below).
Put config
curl -k -H "api-key: hA94wQhR23R8pbGZkxLTn3AmZ8azD8RQ" -H "Content-Type: application/json" -X PUT -d "{\"config\": {\"subtitle\": {\"text1\": \"Updated subtitle\"}}}" https://api.charte.ca/chart_integration/config/PE2vxqfmDLpn9kcU
This call takes JSON containing chart configuration changes and updates the chart. To see full list of all config settings that can be changes, call "Get config" API (see above).
Export chart as an SVG file
curl -k -H "api-key: hA94wQhR23R8pbGZkxLTn3AmZ8azD8RQ" https://api.charte.ca/chart_integration/svg/PE2vxqfmDLpn9kcU -o chart.svg
Export chart as an SVGZ file
curl -k -H "api-key: hA94wQhR23R8pbGZkxLTn3AmZ8azD8RQ" https://api.charte.ca/chart_integration/svgz/PE2vxqfmDLpn9kcU -o chart.svgz
Publish chart
curl -X POST -k -H "api-key: hA94wQhR23R8pbGZkxLTn3AmZ8azD8RQ" https://api.charte.ca/chart_integration/publication/PE2vxqfmDLpn9kcU
The API call is throttled: you cannot invoke it too often.
Unpublish chart
curl -X DELETE -k -H "api-key: hA94wQhR23R8pbGZkxLTn3AmZ8azD8RQ" https://api.charte.ca/chart_integration/publication/PE2vxqfmDLpn9kcU
The API call is throttled: you cannot invoke it too often.